Analysis: The U.S. Airports That Keep You Waiting

We've all heard about the golden rule that travelers need to arrive at the airport two hours before their flight. But is it relevant everywhere? Traveling via plane is one of the quickest ways to reach your destination, but it can also be one of the more stressful options.
That's why the team at PlanetWare set out to find the airports with the shortest security wait times and the most on-time flights. So go ahead and take a break from the chaos of planning and see which airport will ensure you have a stress-free start and end to your vacation.
Key Takeaways
- The average wait time across all U.S. airports is about 10 minutes.
- On average, 81.0% of all U.S. flights have been reported on time since 2014.
- Travelers visiting airports in Hawaii (17.4 minutes) and Illinois (15.7 minutes) can expect longer wait times.
- Travelers visiting airports in Connecticut (2.8 minutes) and Mississippi (3.4 minutes) can expect little to no wait time.
- Flights leaving Hawaii (86.7%), Alaska (86.6%), and Montana (85.8%) are the most likely to be on time.
- Honolulu's airport (HNL) has both the longest average wait time (21 minutes) and more on-time flights than any other major airport in the U.S. since 2014.
- Chicago Midway in Illinois has reported more flight delays (22.6%) and cancellations (5.7%) than any other major airport in the U.S. since 2014.
The U.S. Airports with the Longest and Shortest Wait Times
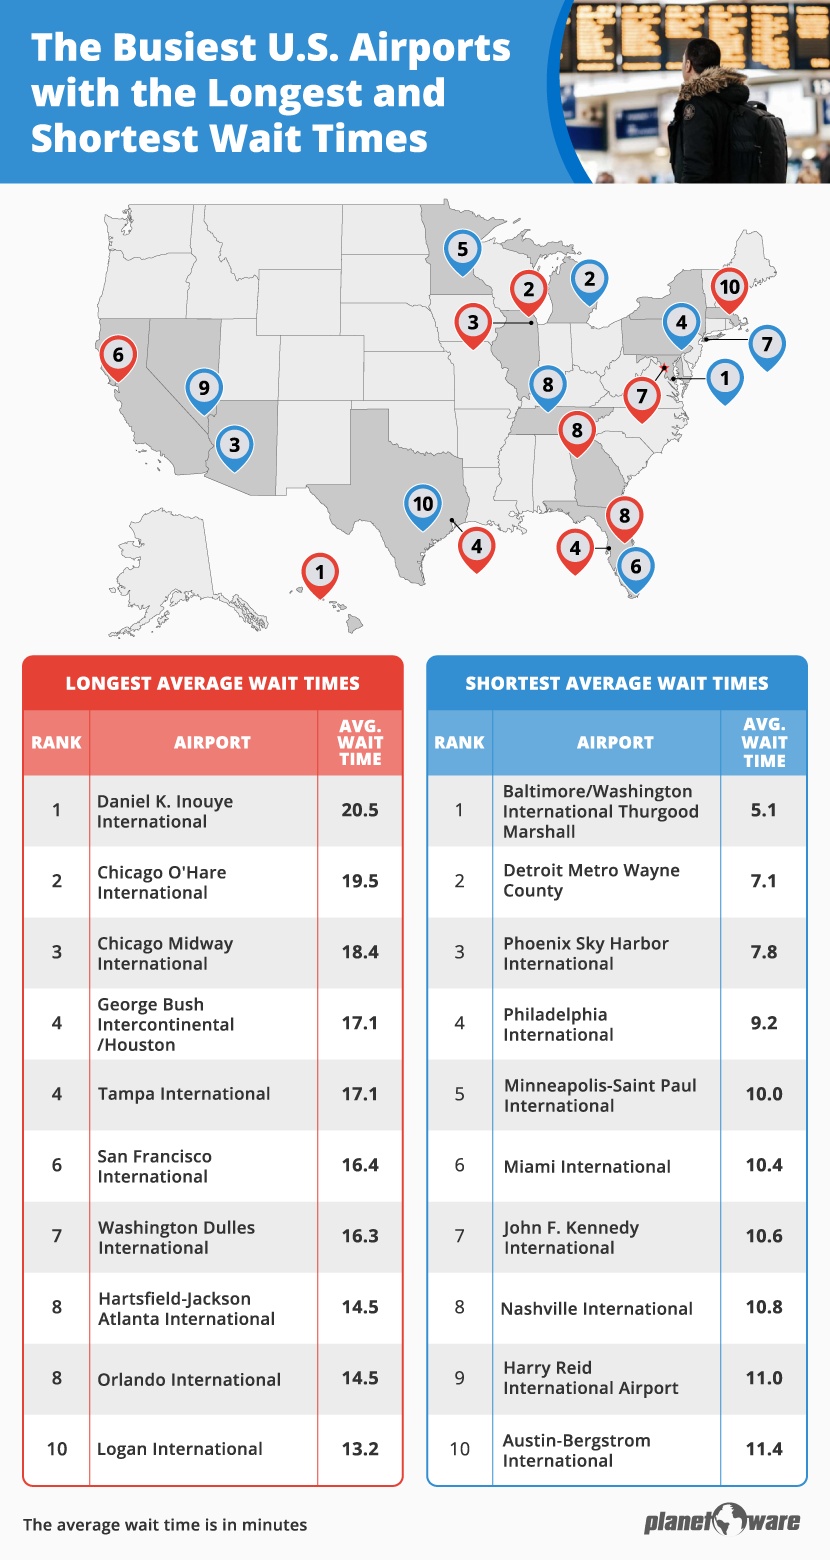
Vacations are meant to relax you and to help reduce the stress that comes from everyday life, but flying can keep you from being able to fully unwind. Airports can be unpredictable. That's why many people arrive two or more hours early to catch their flight. Knowing which airports are likely to have the longest security wait times can help provide travelers with a better sense of when they should arrive.
That's why our team collected data for more than 150 airports nationwide. We calculated the average wait times, by gathering data each day for one week during one of the busiest times at airports, 11 a.m. to 12 p.m. We then ranked airports from the longest to shortest average wait times.
We also understand that some airports are more likely to be visited than others, so to help narrow down our ranking, we used a list of the 31 airports with the most passengers on average each year.
Leading the way for the longest wait time for the busiest U.S. airports is Daniel K Inouye International in Honolulu, HI, with about a 21-minute wait on average. If you are worried about feeling stressed by that wait, be sure to visit one of the top-rated tourist attractions to relieve anxiety before heading to the airport.
Not far behind on our ranking is Chicago O'Hare International in Illinois, at about a 20-minute wait. If you're thinking about making that 45-minute drive south to a different airport, we're sorry to say it won't help much as Chicago Midway International is 3rd on our ranking with about an 18-minute wait on average.
On the other hand, Baltimore/Washington International Thurgood Marshall in Maryland came in 1st for the lowest wait time on average at about 5 minutes. Following closely behind are Detroit Metro Wayne County Airport and Phoenix Sky Harbor International with 7- and 8-minute wait times on average, respectively.
If you didn't find your airport on the list above, don't worry! Below is a table with the full 171 airports ranking based on the average wait time. You can sort the table by wait time or simply search for the airport you plan to visit.
Airports Where Flights Are Most Likely to Be Delayed or Canceled
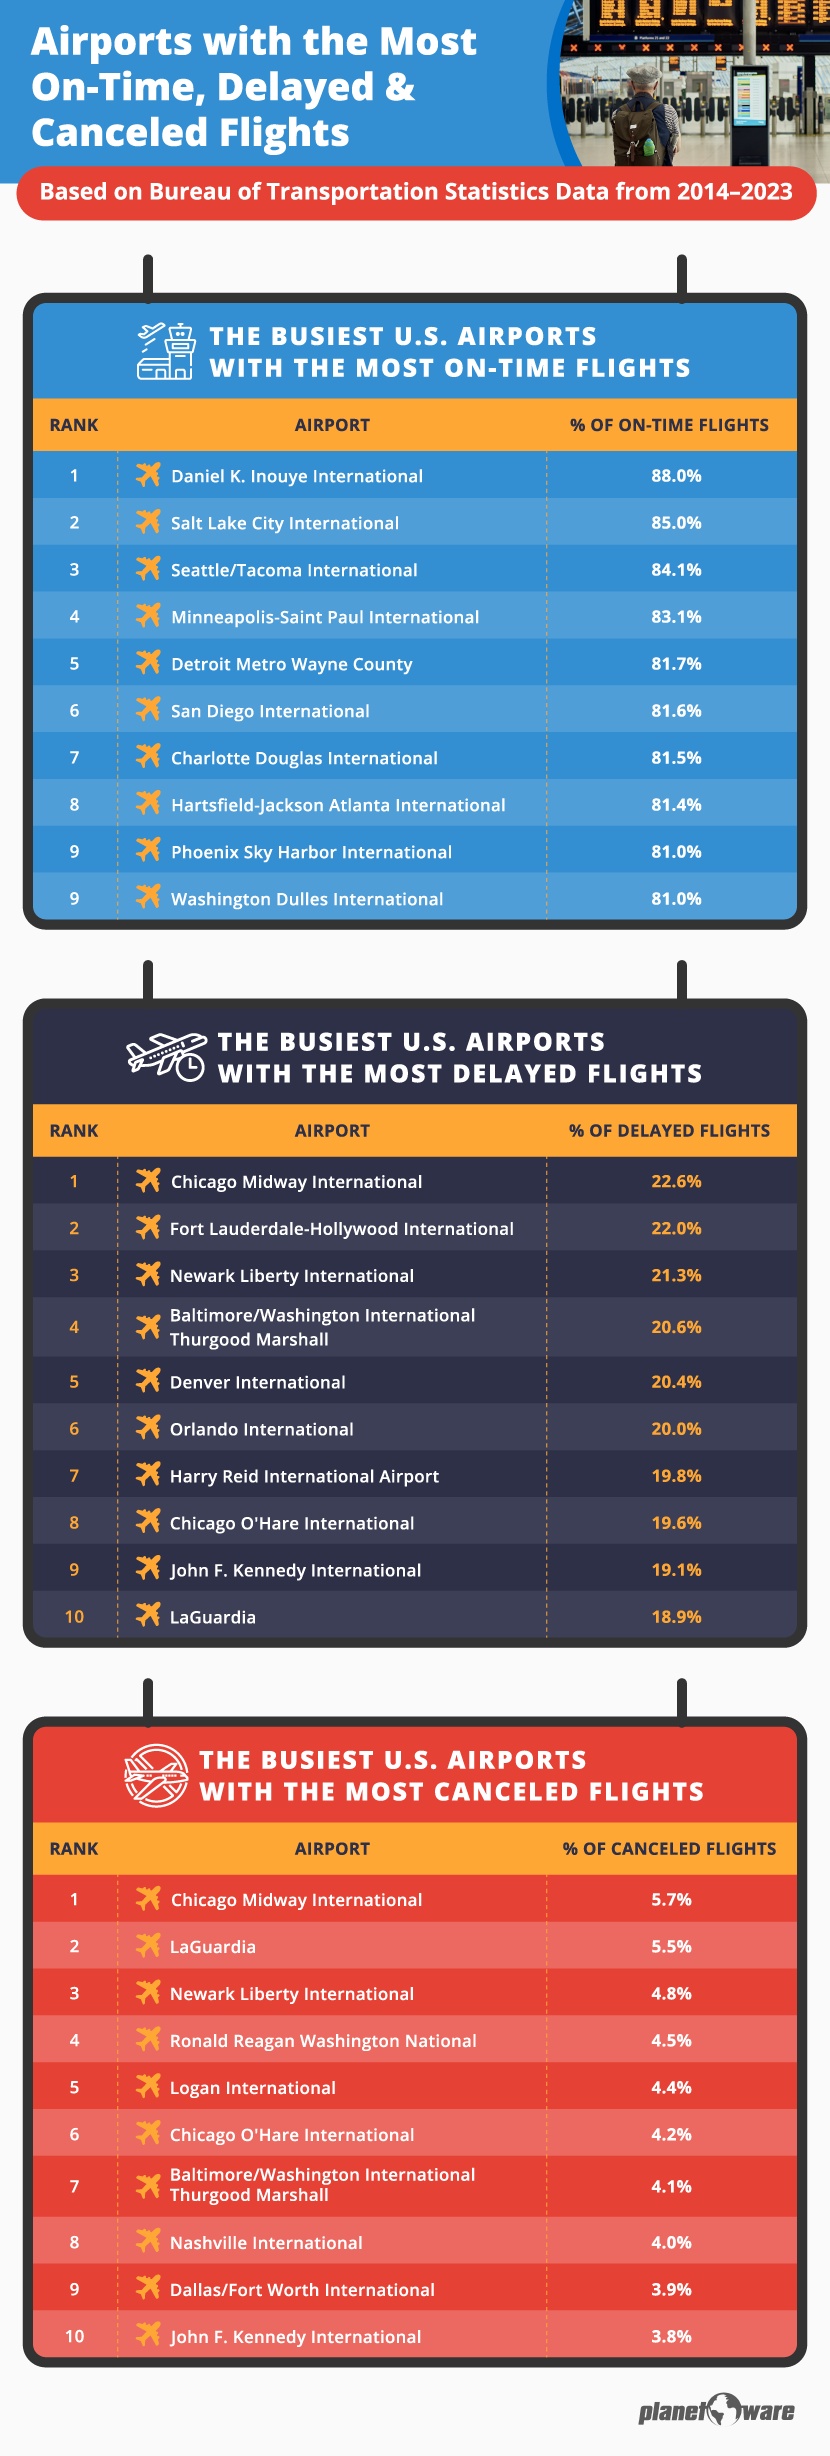
Another aspect of flying that travelers have to keep in mind is the dreaded delayed or canceled flight. To determine which airports are most likely to have on-time flights, we analyzed The Bureau of Transportation Statistics data for flights from 2014 to 2023. Then using the number of on-time, delayed and canceled flights in comparison to the total number of departing flights, we ranked each airport based on their percentages in each category.
Coming in 1st for the busiest U.S. airport with the most on-time flights over the past decade is Daniel K Inouye International. While this airport ranked for the highest security wait time, flights leaving this airport are most likely to remain on track with 88.0% of all flights leaving on time.
In 2nd, is Salt Lake City International in Utah with 85.0% of on-time flights, and 3rd is Seattle/Tacoma International in Washington with 84.1%.
Many airlines are currently struggling with staffing shortages, which has led to many delayed and canceled flights across the country. It can be a frustrating experience for anyone who plans to fly, so we wanted to highlight which airports have reported the most in an attempt to help travelers prepare.
Chicago Midway International has claimed top spots across multiple categories in this study as it ranks 1st for delays (22.6%) and canceled flights (5.7%). If you find yourself stuck in Chicago, make the best of the situation and visit one of the many tourist destinations the city has to offer.
Heading down south, Fort Lauderdale-Hollywood International in Florida ranks 2nd for the most delays with 22.0% of flights missing their initial departure time. Thankfully, the state is surrounded by beautiful beaches to help you relax before heading to the airport.
Staying on the East Coast, we move up north for 3rd in flight delays with Newark Liberty International. About 21.3% of the airport's flights have been delayed over the past decade. Close behind at 20.6%, is Baltimore/Washington International Thurgood Marshall.
Coming in 2nd for the most canceled flights is LaGuardia in New York. Of the airport's more than 41,000 flights, 5.5% have been canceled. Following closely behind, Newark Liberty International has reported that 4.8% of their flights were canceled. Luckily, New York and New Jersey have many attractions to help pass the time until you can catch the next available flight.
While we condensed this data into a smaller ranking of the most visited airports, we want to provide you with information on more than 350 airports across the country. Check out the interactive table below to see how your hometown airport ranks among the busiest airports.
The States with the Best and Worst Airport Wait Times
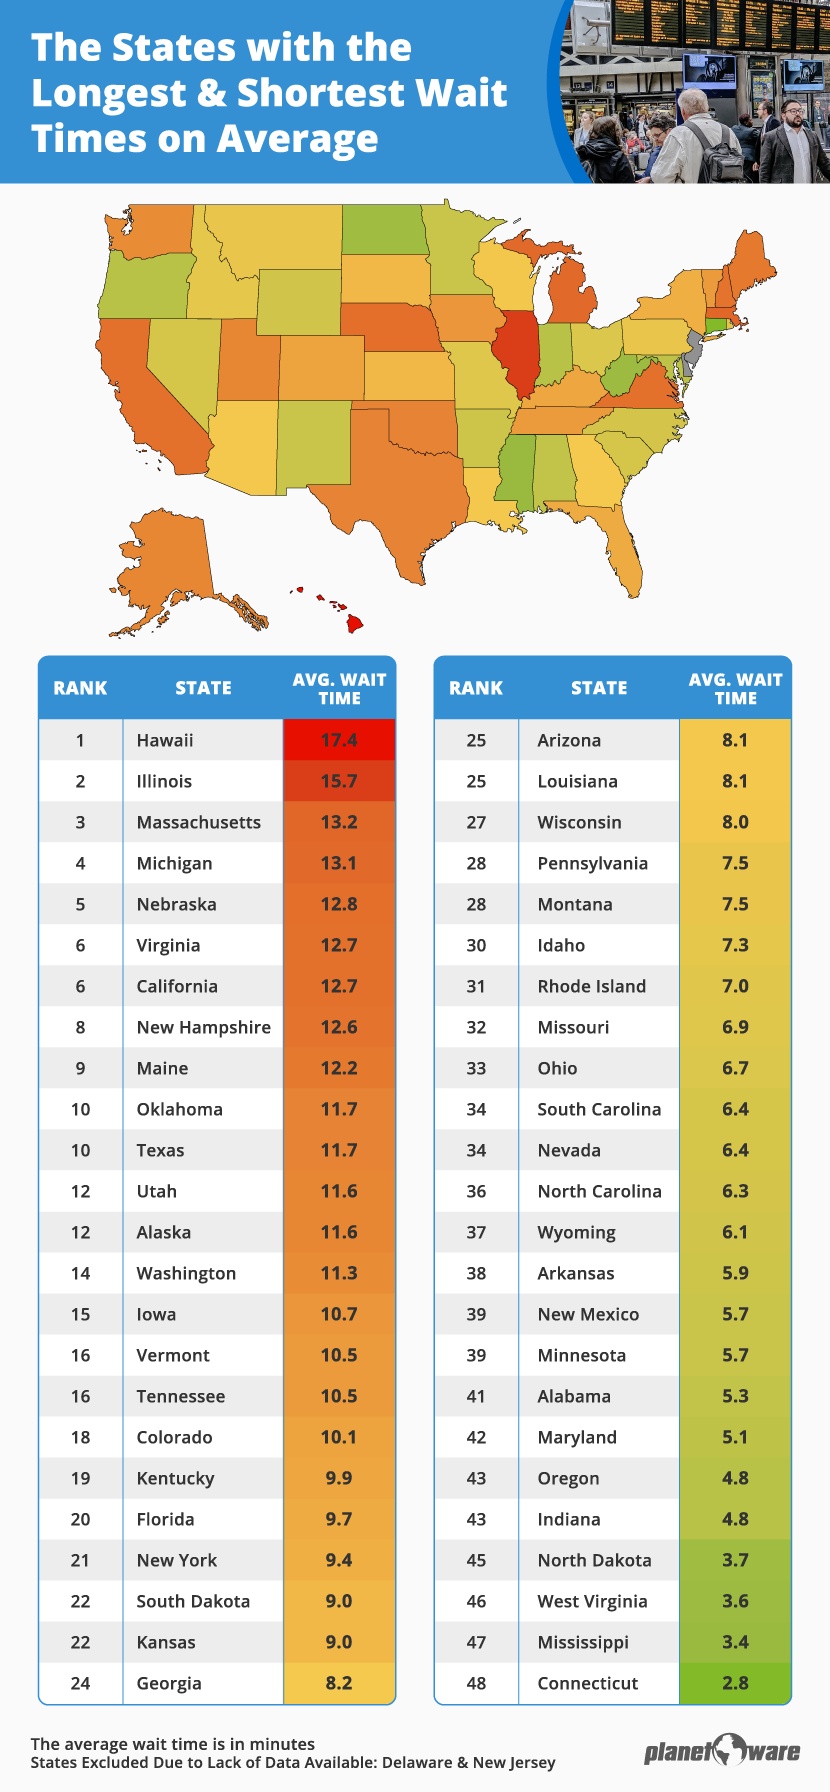
According to the Bureau of Transportation Statistics, there are more than 20,000 airports across the U.S. With several airports in each state, we decided to analyze the data we collected on a state-by-state basis to determine which states have the best and worst airports.
If you are planning to visit an airport in Hawaii (86.7%), Alaska (86.6%), or Montana (85.8%), you're in luck. These states have recorded the most on-time departures across their collective airports since 2014.
Beware if you have a trip scheduled at a Delaware (32.1%), New Jersey (21.8%), or Maryland (20.6%) airport, as these are the states with the highest percentage of delayed flights. Staying out east, the states with the most cancellations are Vermont (6.2%), Maine (6.2%), and West Virginia (5.7%).
Finally, Hawaii and Illinois airports have the highest security wait times on average at 17 and 16 minutes respectively. On the other end of the spectrum, Connecticut and Mississippi airports both rank with the lowest wait time at 3 minutes.
Conclusion
When it comes time to go on vacation, you want to make sure everything goes to plan. That's why our team dug into the airport data so you don't have to. Be sure to make note of which airports are most likely to keep you on time and on track for a perfect getaway.
If you find yourself searching for a way to kill time before heading to the airport or after a canceled flight, check out the variety of travel guides created by our experts. With itineraries for cities all around the world, there is no shortage of fun activities and breathtaking sites to take in while on vacation.
Methodology
In this study, we utilized iFly data to determine the average security wait time for more than 200 airports across the U.S. iFly monitors data on flight volume and when TSA is staffed at certain capacities to determine the estimated wait time by hour. To find an average, we collected the estimated wait time from 11 a.m. to 12 p.m. for each airport across 7 days to find the highest average wait times for each location. Of those airports, only 171 provided enough data for a sufficient sample to be included in this study.
In addition, we utilized the Bureau of Transportation Statistics data to collect the number of on-time, delayed, canceled, and total flights for more than 300 U.S. airports since 2014. Some airports did not include data for every year, so our data only includes airports which had at least four years worth of data (including data from 2022/2023). Using both datasets, we ranked airports to find the locations most likely to remain on time.